In Business Pulse, you can ask questions directly in the chat to quickly find insights from your company’s data. The platform supports natural language queries, so you can type questions as you would normally ask them, and receive answers in text, tables, or charts.
Enter your username and password on the login screen.
Add the authenticator code provided to you by the Business Pulse team. This step ensures secure access to your company’s data.
Once you reach the main page, you’ll see the chat interface. This is where you can start typing your questions.
Enter your query in the chat box and press Enter. Business Pulse will process your question and return an answer in text, table, or chart format.
Business Pulse is designed to understand natural language queries, so you can ask questions in a straightforward way without needing technical knowledge. Below are some common categories of questions you can use:
Use this type of question when you want quick insights into key business numbers. Business Pulse can return figures such as total revenue, expenses, profit margins, or customer growth. These are ideal for at-a-glance performance checks.
Example: “What was our total revenue last month?”
When you need to see how one period, product, team, or region is performing against another, comparison questions are useful. Business Pulse can show differences side by side in text or charts.
Example 1: “Compare Q1 revenue with Q2”
Example 2: “Which region had higher sales, North or South?”
These questions help you analyze how metrics change over time and, where applicable, anticipate future outcomes. They’re particularly useful for spotting growth patterns, customer churn, or seasonal activity.
Example 1: “Show the 1-month trend for new customer sign-ups”
Example 2: “What is the forecast for next month’s sales?”
Business Pulse can also answer questions related to everyday business operations, giving you visibility into activity across teams and processes. These might include customer support, orders, or employee performance.
Example 1: “How many tickets did the support team close last week?”
Example 2: “How many orders were processed yesterday?”
To make your questions more precise, you can apply filters such as date ranges, product categories, teams, or regions. Filters narrow down results so you see exactly the data you need.
Example 1: “Show sales in Region A during August”
Example 2: “What were marketing expenses for Product X in Q3?”
When you ask a question in Business Pulse, the response includes a structured summary to help you quickly understand the data. A typical answer may contain the following elements:
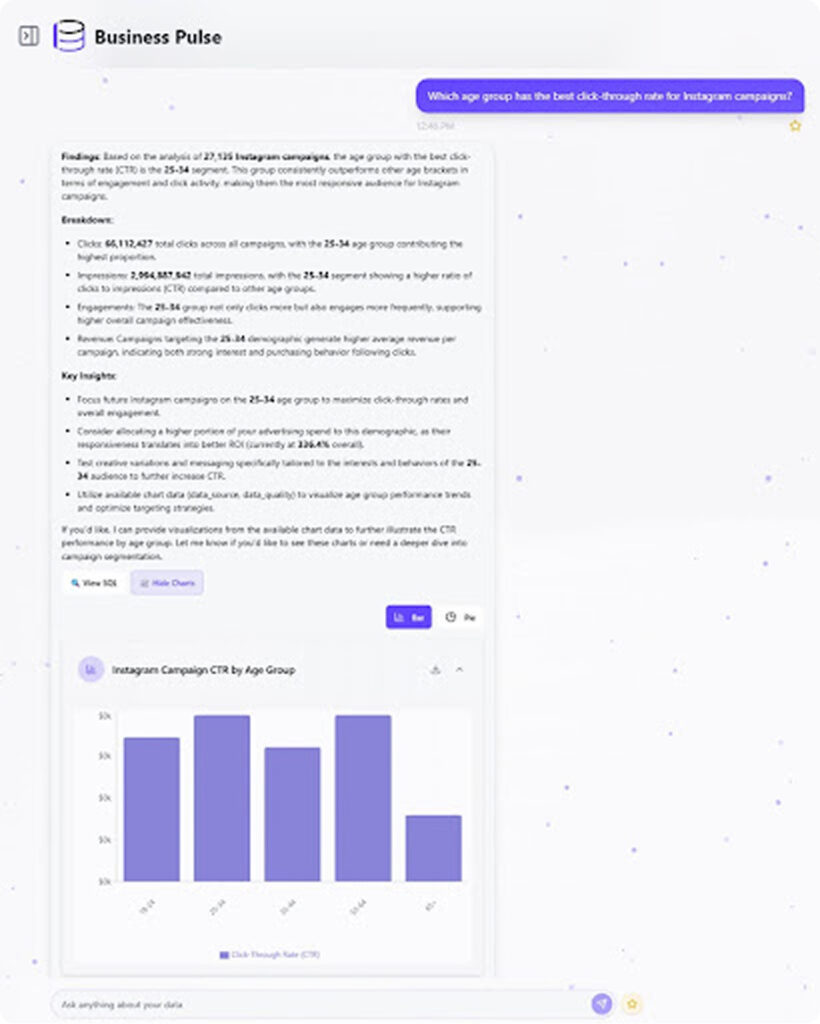
A short overview of the result, highlighting the most important takeaway from the data.
Example: “The age group with the best click-through rate (CTR) is 25–34.”
A detailed explanation of the numbers, such as clicks, impressions, engagement, or revenue. This section shows how the result was calculated and which segments contribute the most.
Action-oriented points that explain what the data means for your business. These may include suggestions on how to optimize campaigns, allocate resources, or improve performance.
Where applicable, Business Pulse generates charts or graphs (e.g., bar, line, or pie charts) to illustrate the data trends. These visual outputs make it easier to spot patterns or compare across categories.
You can refine the results by asking follow-up questions, such as drilling down into a specific segment or switching the visualization type (e.g., from bar chart to pie chart).
Note: Every answer reflects the data your company has connected to Business Pulse. If a dataset is not integrated, the system will not be able to generate results for it.
When asking questions in Business Pulse, you may sometimes encounter errors or unexpected results. Below are common issues and how to resolve them:
Business Pulse may not recognize overly complex or unclear wording.
Fix: Rephrase the question using simpler, direct terms.
Example: Instead of “How are we doing financially in comparison to earlier months?” → ask “Compare revenue this month with last month.”
Very general queries can return incomplete or unhelpful results.
Fix: Narrow your question with filters such as timeframe, product, or region.
Example: Instead of “What were our sales?” → ask “What were our sales in Q2 for Product A?”
If a dataset isn’t connected or doesn’t exist, Business Pulse won’t be able to return an answer.
Fix: Confirm that the relevant data source has been integrated into Business Pulse. If it’s connected, try rephrasing your question.
Using informal or inconsistent names for metrics can lead to incorrect results.
Fix: Use your company’s official naming conventions for metrics and KPIs.
Example: Ask for “Monthly Recurring Revenue” instead of “monthly income.”
Asking effective questions in Business Pulse ensures you get fast, accurate, and actionable insights from your company’s data. By using clear phrasing and refining your queries step by step, you can maximize the value of the platform and make better data-driven decisions.

Get a free Data Maturity Audit and see exactly where your reporting and decision-making can improve.

I'm a product marketer with a focus on B2B SaaS products and I love turning complex ideas into clear strategies that fuel growth and retention. When I'm not mapping customer journeys, you’ll find her binge-reading fictional novels.