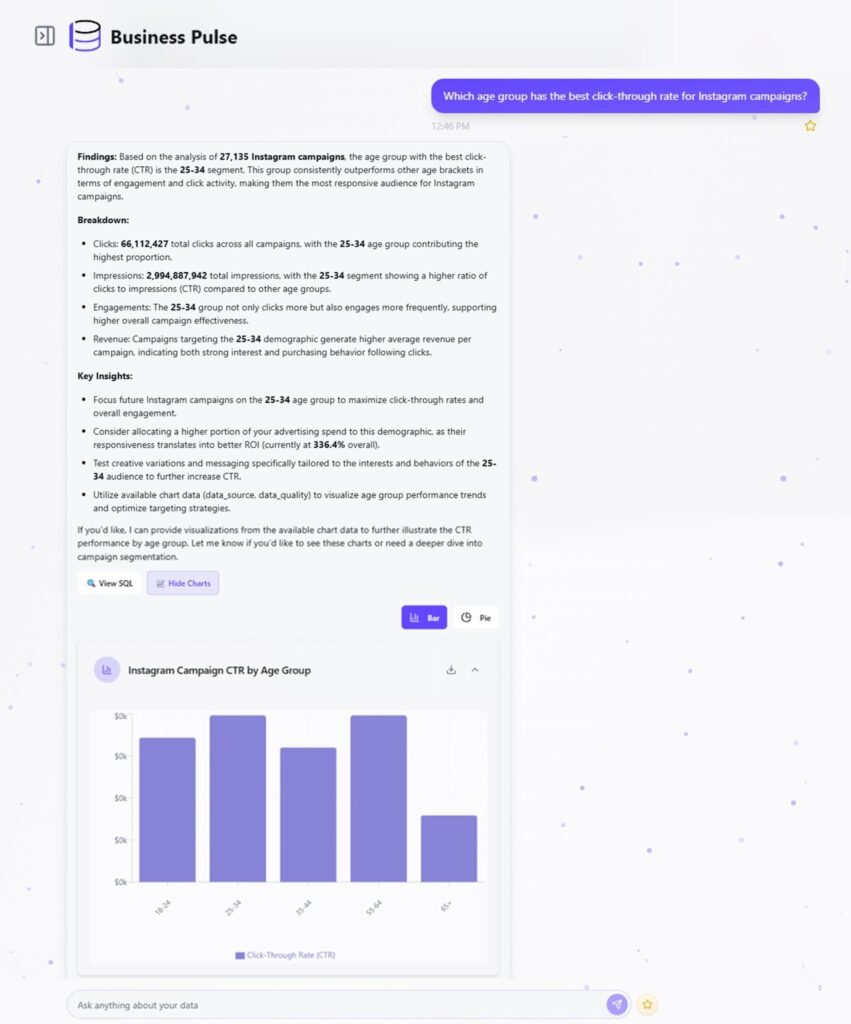
Before you start using Business Pulse, this article will help you get a clear overview of the platform, its main features, and the steps involved in turning data into insights. Use this as your starting point to get familiar with the basics before moving on to setup or advanced features.
Business Pulse is a conversational analytics platform that helps organizations turn their raw data into clear, actionable insights. Instead of relying on static reports or waiting for manual analysis, users can interact with their data in real time and get answers instantly.

It is built for decision-makers, analysts, and teams who need quick visibility into performance without complex tools. By combining reporting, visualization, and conversational analytics, Business Pulse simplifies how businesses monitor key metrics, track progress, and make informed decisions.
Business Pulse provides up-to-date insights that refresh periodically as new data comes in. This ensures users always work with the most current information instead of static files.
Users can ask questions in natural language and receive instant answers. This removes the need to write complex queries or rely on technical teams for every report.
Data can be displayed through interactive charts, graphs, and other visualizations. These visual formats make it easier to spot patterns, compare metrics, and track progress over time.
Business Pulse connects with commonly used data sources, applications, and business systems. This allows teams to bring all their data together in one place for analysis.
Custom alerts can be set up to notify users when key metrics change or thresholds are reached. This helps teams respond quickly without having to monitor data constantly.
Reports, charts, and insights can be shared across teams. This ensures everyone works with the same information and makes decisions based on a single source of truth.
Business Pulse operates by turning raw business data into usable insights through a structured workflow. At a high level, the process works as follows:
Through a single semantic layer, the platform links with data sources such as databases and business applications. This setup is handled during onboarding, since users typically cannot connect all sources on their own. Once configured, data flows into the platform at scheduled intervals, based on client preferences.
During onboarding, the Business Pulse team organizes, and processes the incoming data. Models and logic are then applied to ensure the information is consistent, accurate, and ready for analysis.
Once onboarding is complete, you interact with your data through a conversational interface. Instead of writing technical queries, you can ask plain-language questions or explore prebuilt visualizations designed for common business needs.
Business Pulse delivers results in multiple formats, including instant answers, charts, reports, and alerts. These outputs are designed to match different user preferences, making it easier to review, share, and act on insights.
With accurate and regularly updated data, you can make informed business decisions more confidently. Business Pulse ensures that actions are based on timely insights rather than static or outdated reports.
Business Pulse can be applied across different teams and functions. Some common examples include:
Monitor sales pipelines, conversion rates, and revenue trends in real time to see whether targets are being met.
Track ticket volumes, response times, and resolution rates to maintain service quality and identify bottlenecks.
Use historical and live data to predict customer demand, helping teams plan inventory, staffing, or resource allocation.
Provide leadership with up-to-date reports and summaries, reducing the need for manual reporting and ensuring decisions are based on the latest information.
Measure campaign reach, engagement, and return on investment to understand what’s working and where adjustments are needed.

Track expenses, revenue, and profitability metrics to stay aligned with budgets and financial goals.
Monitor supply chain data, delivery times, or resource utilization to identify areas where processes can be streamlined.
Review team performance metrics, workload distribution, and project progress to ensure productivity goals are met.
If you are new to Business Pulse, follow these steps to begin:
Start with the free trial to explore Business Pulse. You can experiment using the demo data provided and see how the platform responds to different questions. This helps you understand the type of answers and insights you can expect.
Once you are satisfied with the trial experience, you can upgrade to a paid version that best matches your organization’s needs.
After choosing a plan that fits your needs, you’ll connect with the sales team, who will set up your onboarding process. This typically takes a week or more and includes connecting your data sources and preparing them for analysis.
Once onboarding is complete, you will receive the credentials and an admin code to log in to your company’s Business Pulse account. Until then, you will be able to access the free trial account.
Start by asking your first question in plain language. The system responds with clear visuals; charts, graphs, or summaries that make your data easy to interpret. Each query also helps the AI learn from your usage, improving accuracy and depth over time.
Configure alerts to receive notifications when key metrics cross predefined thresholds.
Once you’re comfortable with the basics, expand your usage – ask deeper questions, share insights with your team, and refine how Business Pulse supports your decisions.
Business Pulse makes working with data simple and intuitive. By combining a single semantic layer, guided onboarding, and conversational analysis, it turns raw information into clear answers, visuals, and alerts. As you continue using the platform, the AI adapts to your needs, helping your team move from data to decisions with confidence.
With this foundation, you’re ready to explore more advanced features and tailor Business Pulse to your specific business needs.
Get a free Data Maturity Audit and see exactly where your reporting and decision-making can improve.
Share this Blog

I'm a product marketer with a focus on B2B SaaS products and I love turning complex ideas into clear strategies that fuel growth and retention. When I'm not mapping customer journeys, you’ll find her binge-reading fictional novels.