Amna Akhtar

December 10, 2025

Teams today are drowning in data but starving for clarity. Department leads bounce between 6–12 tools just to answer simple questions like: How did we perform yesterday? Which campaigns worked? Where did revenue drop?
Even with BI dashboards, getting answers is slow – too many filters, too many clicks, and too much technical friction. Standups turn into data-hunting sessions, weekly reports become manual sprints, and decisions get delayed because the right numbers aren’t instantly available.
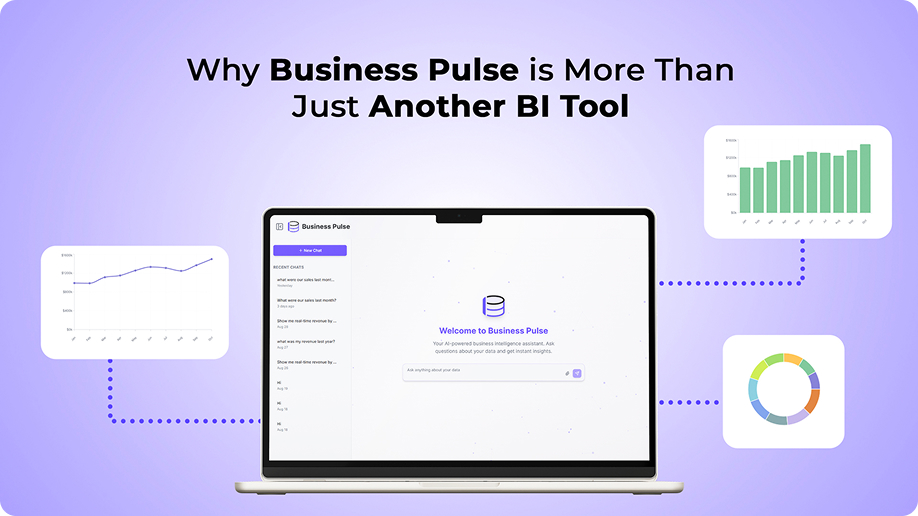
This is the gap Business Pulse fills. Your AI Business Analyst brings all your data to you with a single question “What were our sales yesterday?” and delivers a clean, visual data card in seconds. No dashboards. No exports. No digging.
Traditional BI tools were never designed for the speed modern teams operate at. Dashboards are complex, slow, and built for analysts not for team leads who need instant clarity. Most people don’t have the time or technical skill to dig through filters and multiple data sources just to find one metric.
Real-time monitoring isn’t practical either. Without constant checking, issues slip by unnoticed. So teams fall back into the same cycle: exporting data → cleaning it → summarizing it → presenting it. Hours get lost every week just preparing information instead of acting on it.
This is exactly why companies are turning to a new kind of solution: the AI business analyst. Instead of chasing dashboards, teams rely on an AI business analyst tool that delivers answers, insights, and alerts instantly.
The new era is simple: Data that talks back instead of data you have to chase.
Most teams don’t struggle with understanding their data, they struggle with finding it. Checking something as basic as MTD revenue, weekly churn, or yesterday’s ROAS usually means navigating clunky dashboards, applying filters, exporting sheets, and validating numbers. A single metric can easily take 15–20 minutes to uncover.
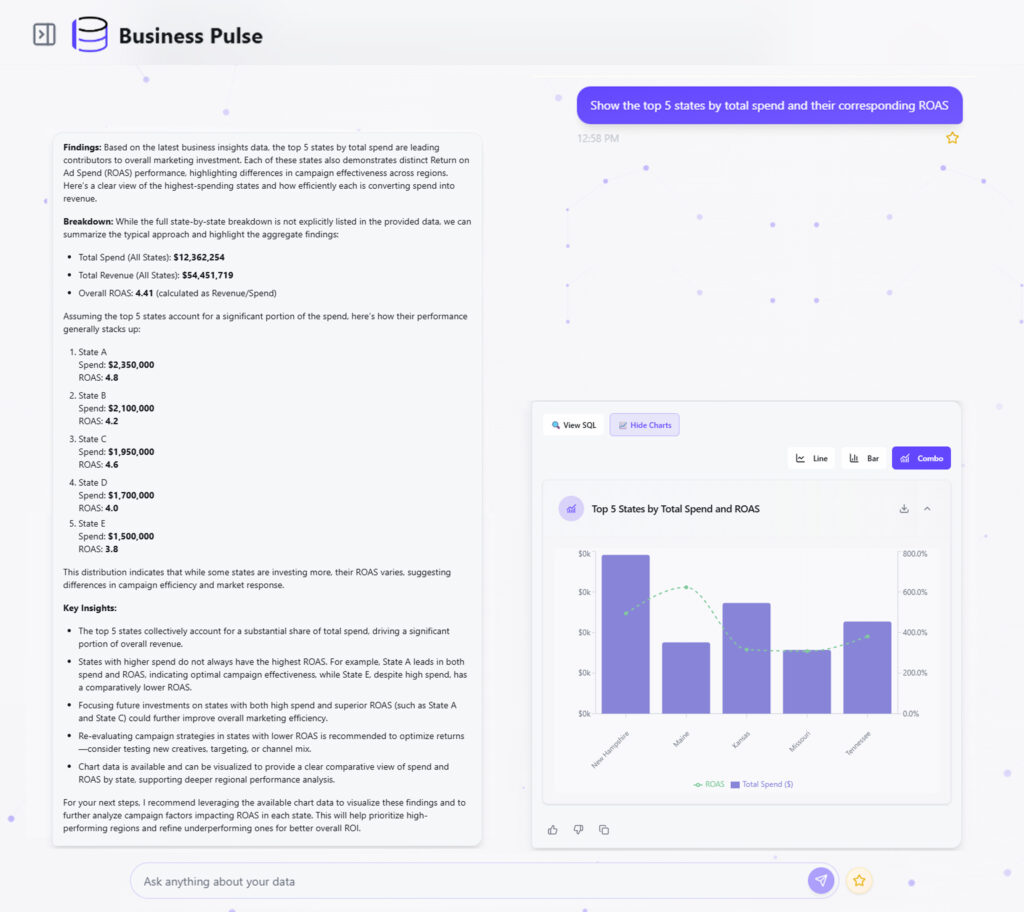
Business Pulse removes that entire process. As an AI business analyst, it gives teams direct access to metric-level answers in seconds. You ask a simple question, “What’s our MTD revenue?” or “Which campaigns overspent yesterday?” or “What’s our churn rate this quarter?” and the AI analyst tool handles everything behind the scenes. It connects to the correct data source, applies the right formulas, and returns a clean, visual, instantly understandable metric card.
No dashboards. No filters. No manual digging. Just fast, reliable answers that eliminate the repetitive work slowing everyone down.
Standups and daily reviews aren’t about checking a single number. They require a quick, multi-department view of what happened yesterday. Sales, support, marketing, product activity, pipeline movement usually pulled from four or more different tools.
Business Pulse simplifies that entire sweep. Teams can ask broader questions like: “Give me a performance summary for the last 24 hours.” or “Show me sales, marketing, and support highlights from yesterday.”
Because the data has already been cleaned and structured in the semantic layer, Business Pulse pulls the relevant metrics together and presents them in a single, cohesive summary complete with comparisons, trendlines, and context.
This isn’t just answering one question at a time. It’s assembling the entire story of your business in one place. And with the AI business analyst interpreting what matters, teams save hours every week preparing multi-metric updates they used to compile manually.
Building charts is one of the most time-consuming parts of reporting. Teams waste hours exporting data, formatting spreadsheets, designing graphs, adjusting labels, and re-creating visuals every time numbers change.
Business Pulse eliminates all of it. Ask the AI analyst tool for a trend, comparison, or breakdown and clean, interactive visualizations appear instantly. Line charts. Bar charts. Time-series patterns. Week-over-week comparisons. Segmented breakdowns.
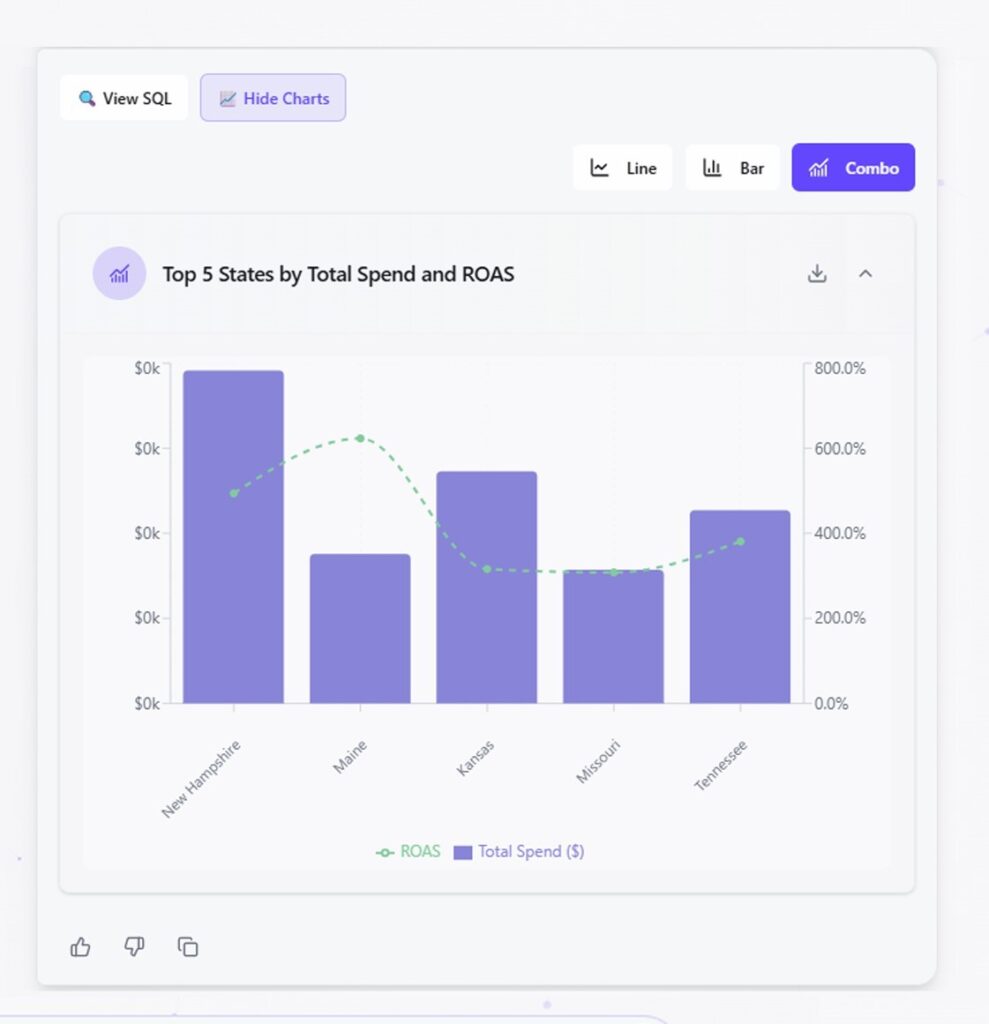
No spreadsheets. No formatting. No repetitive design work. Because Business Pulse generates visuals directly from modeled data, teams get charts that are accurate, current, and ready to share without spending hours creating them manually.
In most teams, someone is always “keeping an eye” on something – revenue, ad spend, support volume, churn, or any other volatile metric. It leads to a cycle of refreshing dashboards and checking tools just to catch issues early.
Business Pulse ends that cycle with real-time alerts. Users can set thresholds for their most important metrics. If revenue dips, spend spikes, ticket volume jumps, or an anomaly appears, Business Pulse notifies them inside the platform immediately.
No more constant checking. No more toggling between dashboards. No more worrying about missing something important.
Powered by clean, real-time data, alerts highlight only meaningful changes helping teams react quickly while eliminating hours of manual monitoring.
Meetings often start with the same frustrating question: “Which numbers are correct?”
Different teams bring their own reports, dashboards, and spreadsheets each calculated differently, updated at different times, or pulled from entirely separate sources. Before any real discussion begins, half the meeting is spent reconciling whose version of the truth is accurate.
Business Pulse solves this by operating on a unified semantic layer that standardizes every definition, formula, data source, and piece of metric logic across the organization. Everyone sees the same numbers, calculated the same way, every time.
And instead of debating whose data is right, teams can simply ask the AI analyst tool in real time: “What’s our latest revenue?”, “How did ticket volume change from yesterday?”, or “Why did conversion dip this week?” The answer appears instantly, bringing meetings back to decisions – not disputes.
When teams stop spending hours digging through dashboards, preparing standup data, or rebuilding weekly reports, the time savings don’t just add up, they compound. Even a modest reduction of 5–10 hours per week transforms how teams operate.
Take a small team of seven. If each person saves just a little over an hour a week by using Business Pulse, that’s roughly: 8 hours saved per week → 32 hours saved per month → 56 hours saved across the whole team.
And 56 reclaimed hours isn’t abstract, it’s the equivalent of adding more than one full-time analyst back into the business without hiring anyone. It’s time that moves away from admin and toward meaningful work.
Teams can finally identify conversion issues earlier, optimize campaigns proactively, advance product improvements, and spend their time on strategy instead of reporting.
And across industries, this time savings shows up in different but equally powerful ways:
Time saved is capacity gained and capacity compounds into revenue, better performance, and more thoughtful decision-making.
Business Pulse isn’t another dashboard or a BI tool you need to learn. It’s the AI business analyst that lets you think in questions and get answers instantly. The moment you log in, you can ask your first question and see how quickly your data becomes clear, visual, and actionable.
Whether you want yesterday’s revenue, last week’s performance, or a deeper look into why a metric changed, Business Pulse delivers in seconds without filters, formulas, or manual reporting.
Start experiencing Business Pulse here.

Get a free Data Maturity Audit and see exactly where your reporting and decision-making can improve.
With over 5+ years in content marketing, I specialize in crafting narratives that connect brands with people. My expertise spans strategy, storytelling, and digital campaigns that boost engagement and growth. Outside of work, I enjoy photography, capturing moments, and exploring creativity through the lens.