Rida Ali Khan

October 11, 2025
Running an e-commerce business?
We can only imagine what goes through your mind on a daily basis. From creating top-of-the-line products to ensuring the operations run smoothly, there’s so much an e-commerce business owner has to consider for success.
Needless to mention, to stay on top of everything, you’ve got to use data to your advantage.
And to help you with that, only the right e-commerce analytics platform can help you get quick insights to your business, track performance, understand customer behavior, and spot growth opportunities before your competitors do.
That’s why we’ve rounded up the 10 best analytics platforms for e-commerce in 2025, so you can choose the one that fits your business needs and helps you make smarter, faster decisions.
You’ve put your blood, sweat and tears into your e-commerce store. And we’re sure when it comes to picking software, you’d want to pick the best one in the market to do the job for you.
To help you nail this task, we’ve handpicked the 10 best e-commerce analytics softwares of 2025 so you don’t have to go through the trouble of trying and testing each.
We’ve also listed their strengths and weaknesses below so you can see which one fits your business needs the best.
Among all the great picks, here’s the one conversational analytics platform that actually lets you chat with your data.
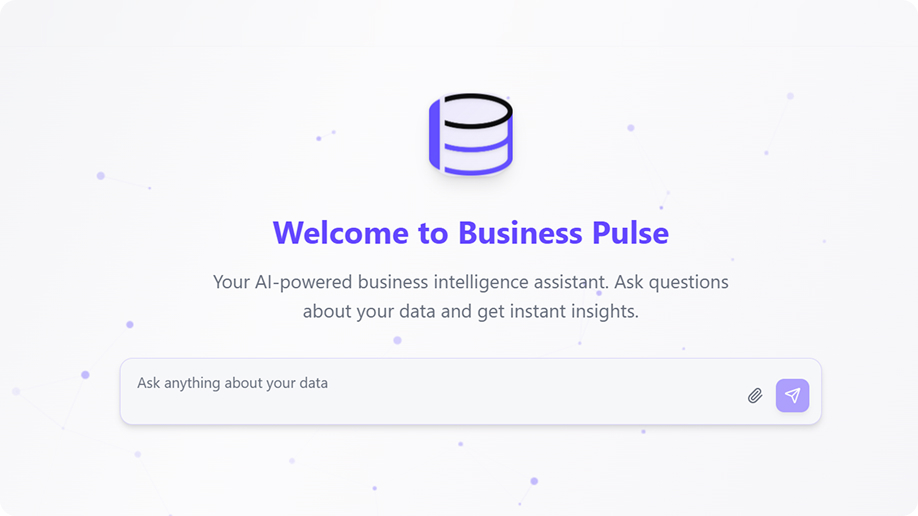
Business Pulse is a chat-based, AI-powered business intelligence & analytics platform designed to let teams interact with their data using plain language. You ask questions like “What were our top-selling products this week?” or “How many visitors came in store X today?” through chat and get instant answers in the form of chat or even charts, tables and summaries.
No SQL, no waiting for reports. Real-time, self-service analytics so decision-makers can act faster.
Following are some features that make Business Pulse a must have for any business:
The reason why Business Pulse is on top of the list and stands tall among other market competitors is that it offers the following factors that can’t be found in any other AI e-commerce analytics software.
Power BI is one of the most widely used business intelligence and data visualization tools in the world. Many e-store owners use it to build dashboards, track KPIs, and share reports across teams.
For businesses already in the Microsoft ecosystem, it’s often the natural choice to move beyond Excel and into more advanced BI.
But while it’s popular and accessible, Power BI is dashboard-centric, meaning users need to build and maintain visual reports. Unlike Business Pulse, which delivers conversational insights instantly, Power BI still relies heavily on manual setup and data modeling.
Features that make a strong candidate in this list include:
Here’s what makes Power BI attractive to e-commerce business owners:
Despite its popularity, Power BI has limitations for e-commerce analytics such as:
Like Power BI, Tableau is a heavyweight in the BI and data visualization world. It shines at turning complex data into clear, interactive dashboards that e-commerce leaders can explore.
Known for its powerful visualization capabilities, Tableau helps e-commerce business owners uncover patterns in sales, customer behavior, and store performance but it requires expertise and configuration to get e-commerce specific insights.
Looker Studio is a Google backed software designed for creating visual dashboards and reports, especially if you’re using Google tools (Analytics, Sheets, BigQuery, Ads).
The only loophole with it is that It’s not focused on conversational querying or predictive analytics but more on visualization, reporting, and sharing insights.
The features Looker Studio brings to the table include:
Here is what users like about Looker Studio:
Here are common weaknesses/complaints from users:
Google Analytics has long been a go-to platform for e-commerce business owners wanting to track website traffic and shopper behavior. It provides a solid snapshot of online performance but its scope is limited, leaving major blind spots when it comes to deeper e-commerce insights.
Google Analytics remains a go-to platform for digital performance tracking.
However, its scope and usability challenges make it less flexible for modern business teams.
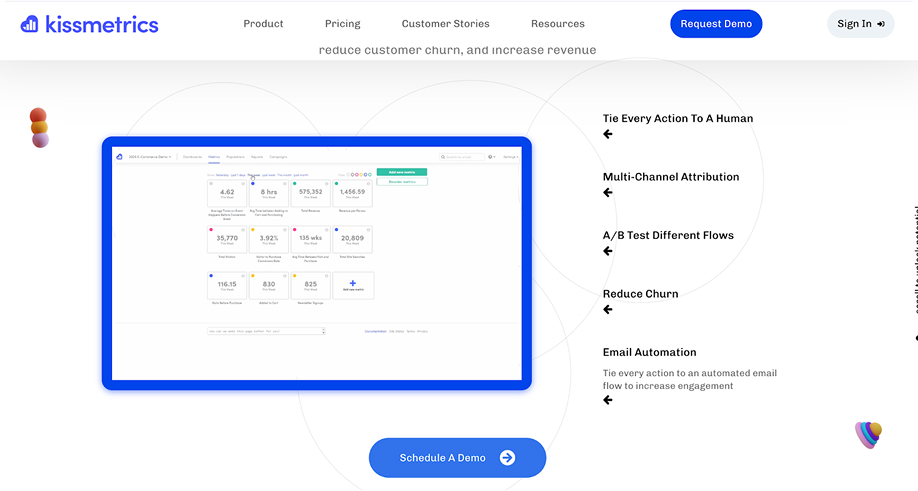
Kissmetrics is a customer analytics platform designed to help businesses dig deeper into user behavior and uncover growth opportunities.
It can enable e-commerce business owners track customer behavior across the entire journey from the first site visit to repeat purchases. It focuses on funnels, cohort analysis, and customer lifetime value, making it easier to see where customers drop off and how retention can be improved.
A couple of affiliate websites point out the following strengths for Kissmetrics:
While Kissmetrics offers valuable insights into customer behavior and revenue drivers, users often point out notable limitations.
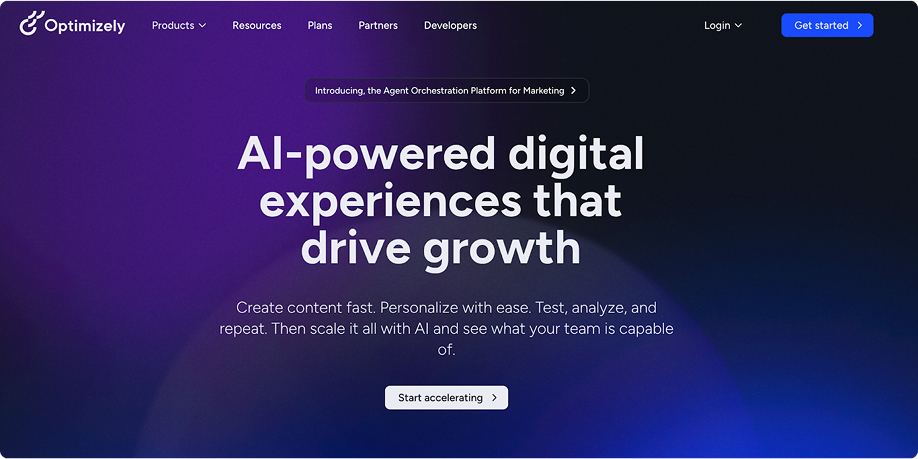
Optimizely is a leading experimentation and personalization platform that helps businesses optimize digital experiences through A/B testing, multivariate testing, and targeted personalization.
While it’s powerful, Optimizely requires specialized setup, ongoing technical expertise, and heavier investment to get full value. This makes it ideal for larger enterprises that can dedicate resources, but less practical for leaner teams who want quick, actionable insights.
Optimizely’s robust capabilities highlighted by the users include:
However, there are also some deal breakers according to the users:
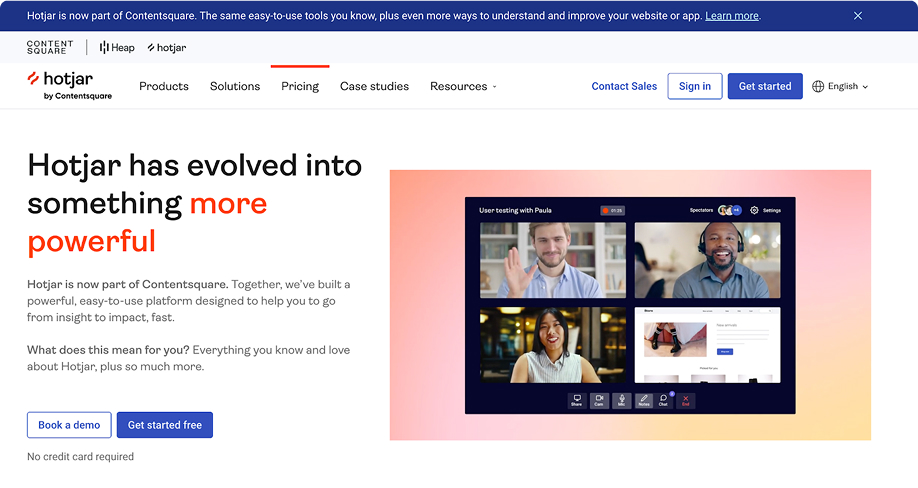
Hotjar is a product experience insights platform that combines analytics and feedback tools to help businesses visualize user behavior and understand customer sentiment.
For e-commerce stores, Hotjar provides heatmaps, session recordings, and on-site surveys to uncover how shoppers interact with product pages and checkout flows. Business owners can identify friction points, improve page layouts, and capture real customer feedback to increase conversions and reduce cart abandonment.
Users value Hotjar’s simplicity and visual insights.
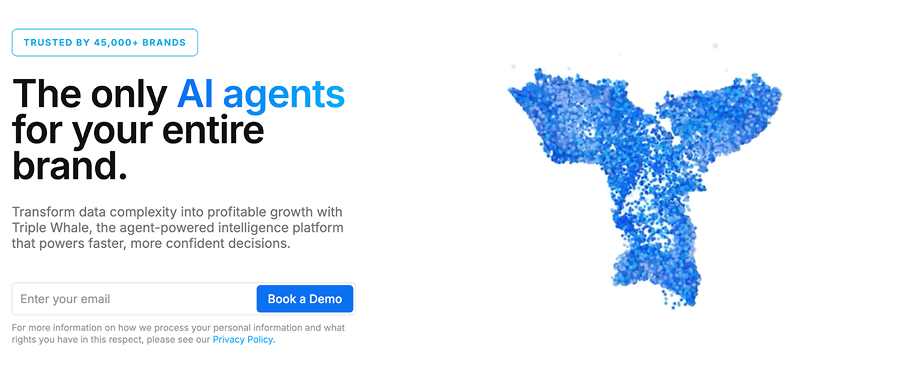
Triple Whale is an advanced e-commerce analytics platform designed to give brands clarity into their performance by centralizing data across channels.
With Triple Whale, business owners can track their most important KPIs in real time, understand attribution across different marketing channels, and make data-backed decisions to improve profitability.
Let’s take a look at what users highlight as strengths of Triple Whale.
On the flip side, users also point out some challenges with Triple Whale.
Glew is an all-in-one commerce data platform that centralizes e-commerce, marketing, and e-commerce data to provide actionable insights for growth.
For e-commerce, Glew helps owners consolidate data from multiple sales and marketing channels, monitor KPIs, and analyze customer and product performance. This makes it easier to identify best-selling products, profitable customers, and growth opportunities across channels.
Glew offers powerful multi-channel analytics and user reviews highlight advantages such as:
Some users find areas of reporting less customizable
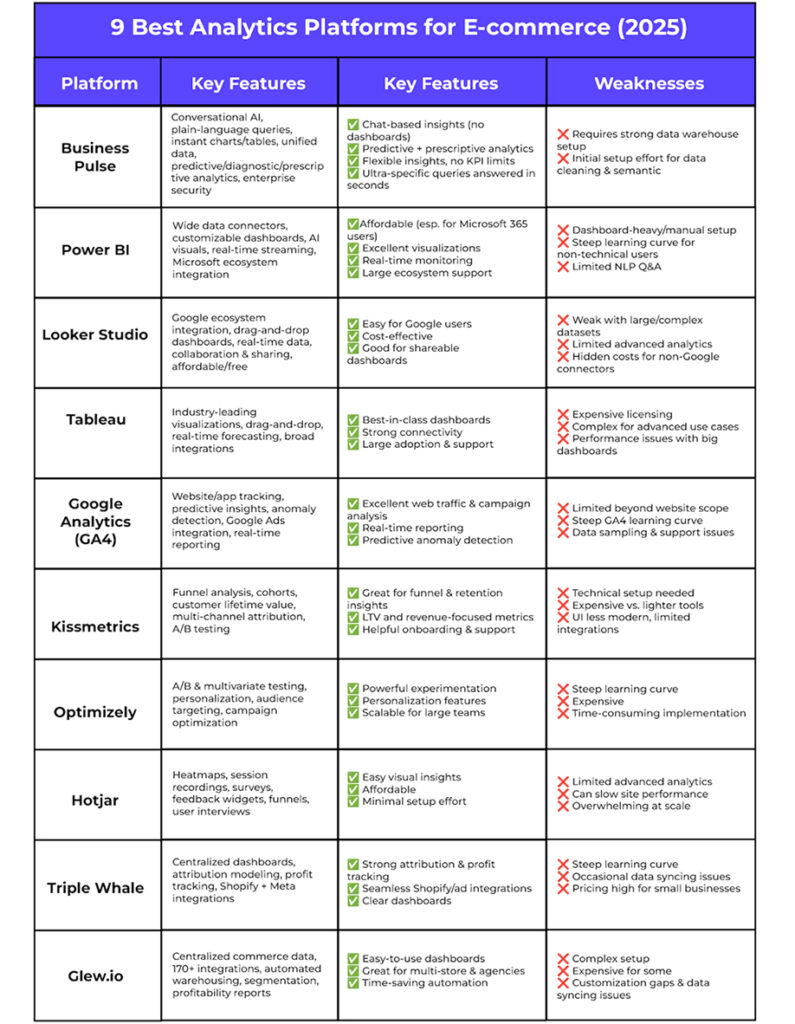
Let’s stack these platforms against each other so you can see how they compare at a glance:
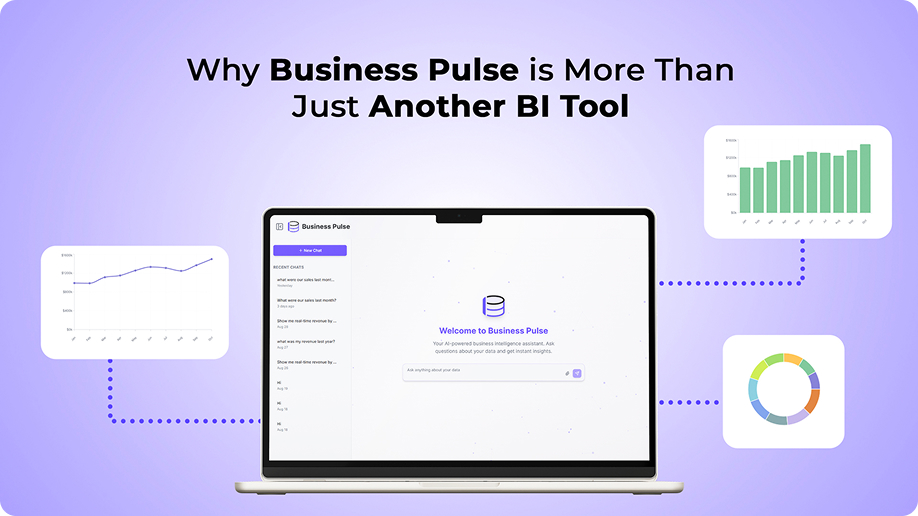
Most e-commerce analytics platforms look different on the surface, but at their core, they all work the same way, through dashboards. Dashboards can be powerful, but they’re time-consuming, rigid, and often locked away with analysts.
Business Pulse breaks that cycle. It’s the only BI software that lets you simply chat with your data and get insights in seconds, no dashboards, no waiting, no bottlenecks.
In short, while the other tools might offer data visualization or reporting, Business Pulse is your conversational data assistant, the tool that finally lets anyone across the business ask questions related to company data and enables them to act on the answers with quick actionable insights. Immediately.
Moreover, with Business Pulse, you get predictive, diagnostic, and prescriptive insights all in a single platform, eliminating the need to juggle multiple niche specific tools to fill the gaps.
These two factors can easily make Business Pulse a preferable choice over the rest of the competitors.
In case you want a better understanding, here’s a quick sneak peak of Business Pulse in action:
Picking the right e-commerce analytics platform isn’t just about who has the prettiest dashboards or the biggest name in the market. The real question is: which tool will actually help your business make smarter, faster decisions? Here are a few things worth weighing before you commit:
It’s easy to get drawn to free or cheap tools, but in analytics, “free” often comes with hidden costs.
A platform like Looker Studio, for example, may work for small projects, but it struggles when your needs grow. Instead of focusing only on the price tag, think about value.
Business Pulse saves teams from spending extra on analysts or waiting weeks for reports because it delivers answers in real time, so your ROI shows up much quicker.
If your team has to go through hours of training before they can even run a report, that’s a red flag. The best platforms make analytics accessible to everyone, not just data specialists.
That’s where conversational tools like Business Pulse really stand out, you just ask your question in plain English and get your answer instantly, no SQL or dashboard maze required.
Most e-store owners are juggling data from multiple sources: POS systems, e-commerce sites, marketing campaigns, and CRM tools.
If your analytics platform can’t bring all of this together, you’ll never get the full picture.
While traditional tools, they usually require technical set up. While with Business Pulse it makes sure that your data sources are integrated seamlessly.
Data is one of your most sensitive assets, so your platform must treat it with the care and attention it deserves.
Not all tools take compliance seriously, especially free ones. Business Pulse, however, bakes in enterprise-grade security, compliance, and role-based permissions so you can trust the insights without worrying about risk of data being accessed by any other party.
Analytics should be an investment that pays for itself.
Think reduced costs, quicker pivots, and better decisions. Some tools like Buxton or CARTO offer great niche insights but don’t always scale to broader needs. Like we said earlier, Business Pulse delivers across the board, giving you predictive, diagnostic, and prescriptive insights, all in one place, so you’re not paying for multiple tools to cover different gaps.
Charts and dashboards are helpful, but only if they’re easy to interpret. Platforms like Tableau and Power BI excel in creating custom visuals, but they can be complex to set up.
Business Pulse blends clean visualizations with conversational responses. So, you don’t just get charts, you get context that makes them meaningful.
Picking an analytics platform is about finding balance between cost, ease of use, integration, compliance, and the ability to grow with you. Business Pulse nails that balance by offering conversational analytics, strong security, and fast ROI, making it the smartest choice for businesses that want more than just dashboards.
We know you probably still have a few questions about e-commerce analytics tools, so here are some quick answers to the most common ones business owners ask:
Most platforms connect with your e-commerce store (like Shopify, WooCommerce, or Magento), marketing platforms, CRM, and payment systems.
With traditional BI tools, integration often requires repeated setup or manual refreshes. In contrast, modern solutions like Business Pulse streamline this process by automating data connections and syncing updates in the background.
Meaning you spend less time managing integrations and more time acting on insights.
Without analytics, online sellers rely on gut feeling. These platforms help optimize pricing, track customer journeys, improve ad performance, reduce cart abandonment, and maximize profitability with data-driven decisions.
Pricing models vary from free options like Google Looker Studio to subscription-based tools like Tableau, Sisense, and Business Pulse. Costs typically depend on the number of users, integrations, and level of analytics sophistication.

Get a free Data Maturity Audit and see exactly where your reporting and decision-making can improve.
With over 5+ years in content marketing, I specialize in crafting narratives that connect brands with people. My expertise spans strategy, storytelling, and digital campaigns that boost engagement and growth. Outside of work, I enjoy photography, capturing moments, and exploring creativity through the lens.